Free large model runs 40,000 times, with a minimum success rate of 0.3%
The few actual measurements in the past few days were all adjusted on-site several times, which only proved that "it can be adjusted at this moment." This time I pulled out the production log of the gateway for a month: 44144 calls, 49.7 million tokens, and 7415 failures. Cerebras have the highest success rates of 98.7%, GLM-4-Flash 98.2%, and Kimi has the lowest success rates of 0.3%(4 successes in 1554 attempts). I also found two things: the delay in my previous newspaper was wrong, and the gateway bill was inaccurate in both directions, one of which sent the account to the arrears and suspension of service.
A few days ago, I wrote two free actual measurements of large models. Both of them were adjusted on site several times and recorded whether they could work and whether they were fast. There is a natural problem with that testing method: it can only prove that "it can be adjusted at the moment" and cannot prove that it can be used in the long term.
Change your approach this time.
There is a model gateway hanging on my server, and all major model calls of the project go through it. It writes every call into the database: which model was taken, success or failure, how much time it took, and how many tokens it burned.
I pulled out my diary for the last month.
There were 44144 calls and 49.7 million tokens, covering the entire month from July 12 to August 12, 2026.
This is not laboratory data, it is derived from real business. The results are a little far from what I wrote a few days ago.
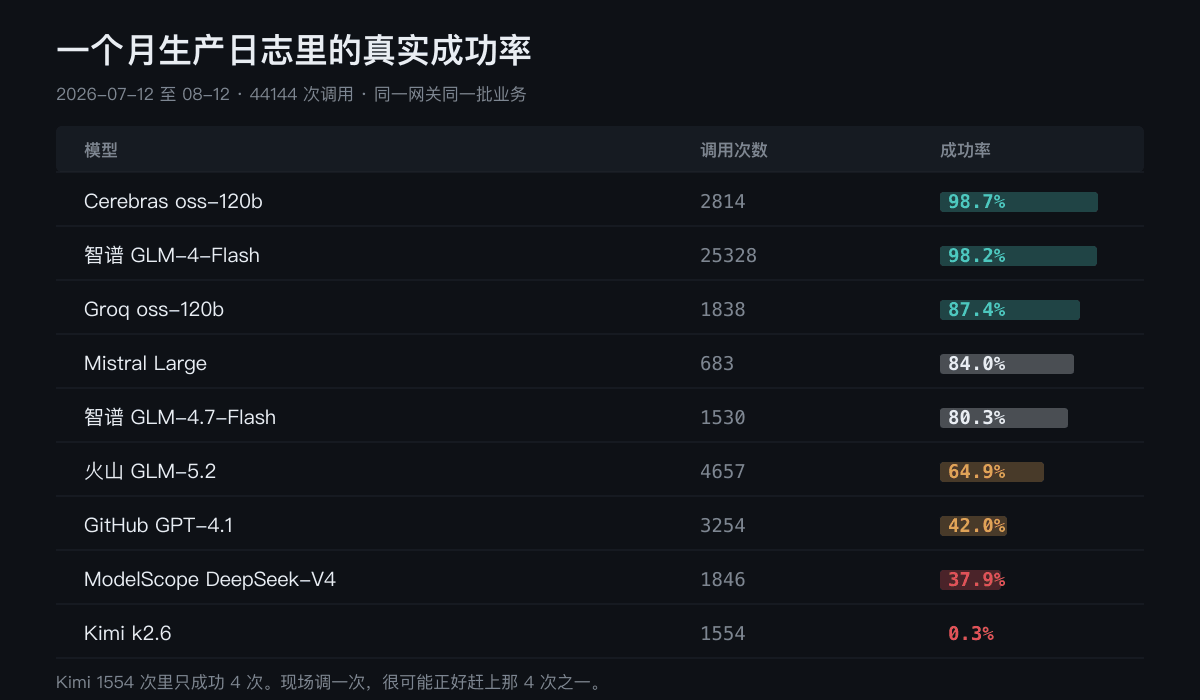
success rate ranking, the lowest one is only 0.3%
Look at the most important list first. The success rate here is the proportion of "calls returning available results" to all calls to the model:
| model | number of calls | success rate |
|---|---|---|
| Cerebras oss-120b | 2814 | 98.7% |
| Smart Spectrum GLM-4-Flash | 25328 | 98.2% |
| Groq oss-120b | 1838 | 87.4% |
| Mistral Large | 683 | 84.0% |
| Smart Spectrum GLM-4.7-Flash | 1530 | 80.3% |
| Volcano GLM-5.2 | 4657 | 64.9% |
| GitHub GPT-4.1 | 3254 | 42.0% |
| ModelScope DeepSeek-V4 | 1846 | 37.9% |
| Kimi k2.6 | 1554 | 0.3% |
I have watched Kimi's line three times. There were 1554 calls, and 4 successful times.
Of the 1550 failures, the log recorded the same type of error, which took an average of 15 milliseconds. 15 milliseconds means that the request is returned before it reaches the model, which is an instant rejection at the authentication or quota level. The error stack in the gateway record was truncated, and I couldn't confirm which link it was stuck in, so I only talk about the phenomenon here: it was basically unavailable on my account for a month.
The most noteworthy thing about this matter is that if you just tune it on site, you probably won't be able to detect it. If you are lucky enough to catch one of those four successes, you will put it on the "available" list.
The two in front were surprisingly stable. Cerebras is 98.7%, and GLM-4-Flash has 98.2% of the base of 25,000 calls. The larger the base number, the more important the problem is. A model that has been adjusted 25,000 times can still maintain 98%, which is completely different from being adjusted 50 times and successfully 49 times.
The ones in the middle are also worth a look. Volcanoes are 64.9%, which means that one out of three has to start again. GitHub GPT-4.1 is only 42%. This figure has its background: GitHub Models was completely retired on July 30, and it was in the process of retiring for quite a while during this month. ModelScope's DeepSeek-V4 is 37.9%, which is consistent with its subsequent removal of models.
The delay in my previous newspaper was wrong
This one needs to be recognized separately.
In the August 10th article, I wrote GLM-4-Flash "Return in 1.5 Seconds", which was measured by a short question I checked on the spot. In the production log, the average time taken for the same modelis 21 seconds.
Fourteen times worse. At first, I thought that the model had slowed down, so I broke down the time consumption by interval and saw that it was not:
| time-consuming interval | number | Average output token |
|---|---|---|
| Within 3 seconds | 721 | 360 |
| 3 to 10 seconds | 3385 | 417 |
| 10 to 60 seconds | 20696 | 1505 |
| more than 60 seconds | 69 | 3298 |
More than 80% of calls fall in the 10 to 60-second range, and the average output of that range is 1505 tokens. For the 721 returns in 3 seconds, the average output was only 360 tokens.
The model has not slowed down, the task has become longer.
This leads to a judgment that I will keep in mind in mind in the future: Talking about delay apart from output length is like not talking about it. Any review tells you that a model "returns in a few seconds", you have to ask first: How many words did it output at that time? The speed measured by taking a twenty-word question and answer is an order of magnitude away from the fact that you actually asked it to write a long text of 1,500 tokens.
I myself am the one who gave the wrong number, so I wrote this article very hard.

The one with ## has become the one who works the most
There is another number I have been staring at for a long time.
GLM-4-Flash was called 25328 times, accountingfor 57.4%of all calls; it consumed66.5%of the total tokens.
By design, it isthe last line of defensealong the entire chain. In front of them are stronger models such as Volcano, GitHub, Cerebras, and ModelScope. Only if they all fail will it get its turn.
As a result, it did more than half of the work.
This incident in turn illustrates how high the failure rate in the previous few links is. Among the total 44144 calls, 7415 failed, with a success rate of 83.2%, which meansthat on average, one out of every six calls has to go to the next step. As we walked, a large amount of traffic fell to the weakest model at the bottom.
There is a hidden danger that is easy to overlook: you think that the system's capabilities are determined by the strongest model at the head of the chain, but in fact it is determined by the weakest model at the bottom. Because it is the latter that actually handles most of the requests.
If you're using a similar downgrade chain, it's worth checking the actual hit ratio of each ring. The main force on the design drawing and the main force in the diary are probably not the same.
bills are inaccurate in both directions
This was the most unexpected discovery of this time through the diary.
The total monthly cost recorded by Gateway was$5.64. It seems reasonable: more than 40,000 calls, 50 million tokens, and more than five dollars are spent, which is almost free.
But this number is wrong at both ends.
Let's start with the overrated end. Of the $5.64, 5.58 is recorded in GPT-4.1. But I checked the actual exit addresses of these calls, and I used models.github.ai, which is the free channel of GitHub Models. The gateway did not know that this channel was free, so it estimated the cost based on OpenAI's official price list.
The money was never spent at all. In other words, 99% of the amount on the bill is a false estimate.
Besides, the one that was missed is much more deadly.
There is a model called glm-5-2-260617 in the log. It was called 150 times and burned 480,000 tokens. The cost of the gateway record was0.00000.
And this model ID is exactly the channel for which charges are to be charged.
I specifically wrote about this pit in the article on August 11: The volcano's GLM-5.2 must be called with the EP ID of the authorized access point for free, and directly using the Model ID is paid by the Token, and the call is completely normal. No errors will be reported.
The day after writing that article, I found 150 such calls in my journal.
Then today, this account reported arrears. When you adjust any model of the volcano, including the access point that was originally free, you will return an account arrears error.
The whole chain is like this: a payment channel is mixed into the configuration, everything is called normally without any errors, and the gateway bill shows that the cost is zero until the account balance is deducted andit is locked together with the free credit.
Therefore, the fact that "the gateway showed that 0 yuan was spent" does not make people feel at ease at all. It may have really not spent money, or it may have no idea that this channel would cost money.

How to choose
After spreading out the data for this month, my own arrangement changed.
To be stable, choose Cerebras and GLM-4-Flash. 98.7% and 98.2%, and the latter was achieved on a base of 25,000 times. I will hang GLM-4-Flash on the last link of any link. It is weak, but it hardly drops the chain.
Don't just look at the results of one call. Kimi is 0.3% in my case, but it may be good on other people's accounts, because the large probability of failure is related to the quota and account status, not the model itself. The reverse also holds true: if you test it on site, it doesn't mean it will work tomorrow. To judge whether a free model can go into production, you have to look at its continuous running record on your own account for a period of time.
Be prepared for failure as the norm. Of the 44144 calls made this month, 7415 failed, with an overall success rate of 83.2%, andan average of one out of six calls had to be repeated. Without an automatically downgraded link, these 7,000 times would be more than 7,000 errors appearing on the user's face. The biggest cost of free models is not money, but thatyou have to write a complete set of retry and downgrade logic for their instability.
Keep an eye on those channels that do not report errors. The model that reports errors is not terrible, it tells you on the spot. The scary thing is that like the payment channel in the volcano, the call is normal, the bill is zero, until the account is detained. Go to the supplier's back office regularly to check the real bill. Don't just believe the numbers in your gateway.
The boundaries of this data
It has to be clear what it can and cannot prove.
This isa record of more than 40,000 times for one account, one month, from my own server. The number of calls for each model in it varies greatly. GLM-4-Flash has 25,000 times, and Mistral has only 600 times. The success rate error for those with small sample sizes will be even larger.
I did not attribute the reasons for the failure one by one. Some are problems on the model side, and some are problems on my side that are exhausted or misconfigured, which cannot be distinguished in the log. Therefore, the above table is more suitable as"what is the approximate level of stability of these models under similar use intensity" rather than an authoritative score for each service quality.
But one thing I can be sure of: this kind of data can only be generated by myself. No public list of free models will tell you that a model has a 0.3% success rate in real business, because the person who wrote the list only adjusted it once, and it worked that time.
If you also use free models in production, one of the most worthwhile things to do is to write down the results of each call. The form you have in your hand in a month will be more credible than any evaluation.